FileMaker Crosstab Reports
DB Services
Summary
Product Type: Extensions
Price: Free
Last updated: 6/14/2017
Language: English
Product websiteCategory
Create Cross Tab reports using native FileMaker.
Create Cross Tab reports using native FileMaker to make flexible and fast reports.
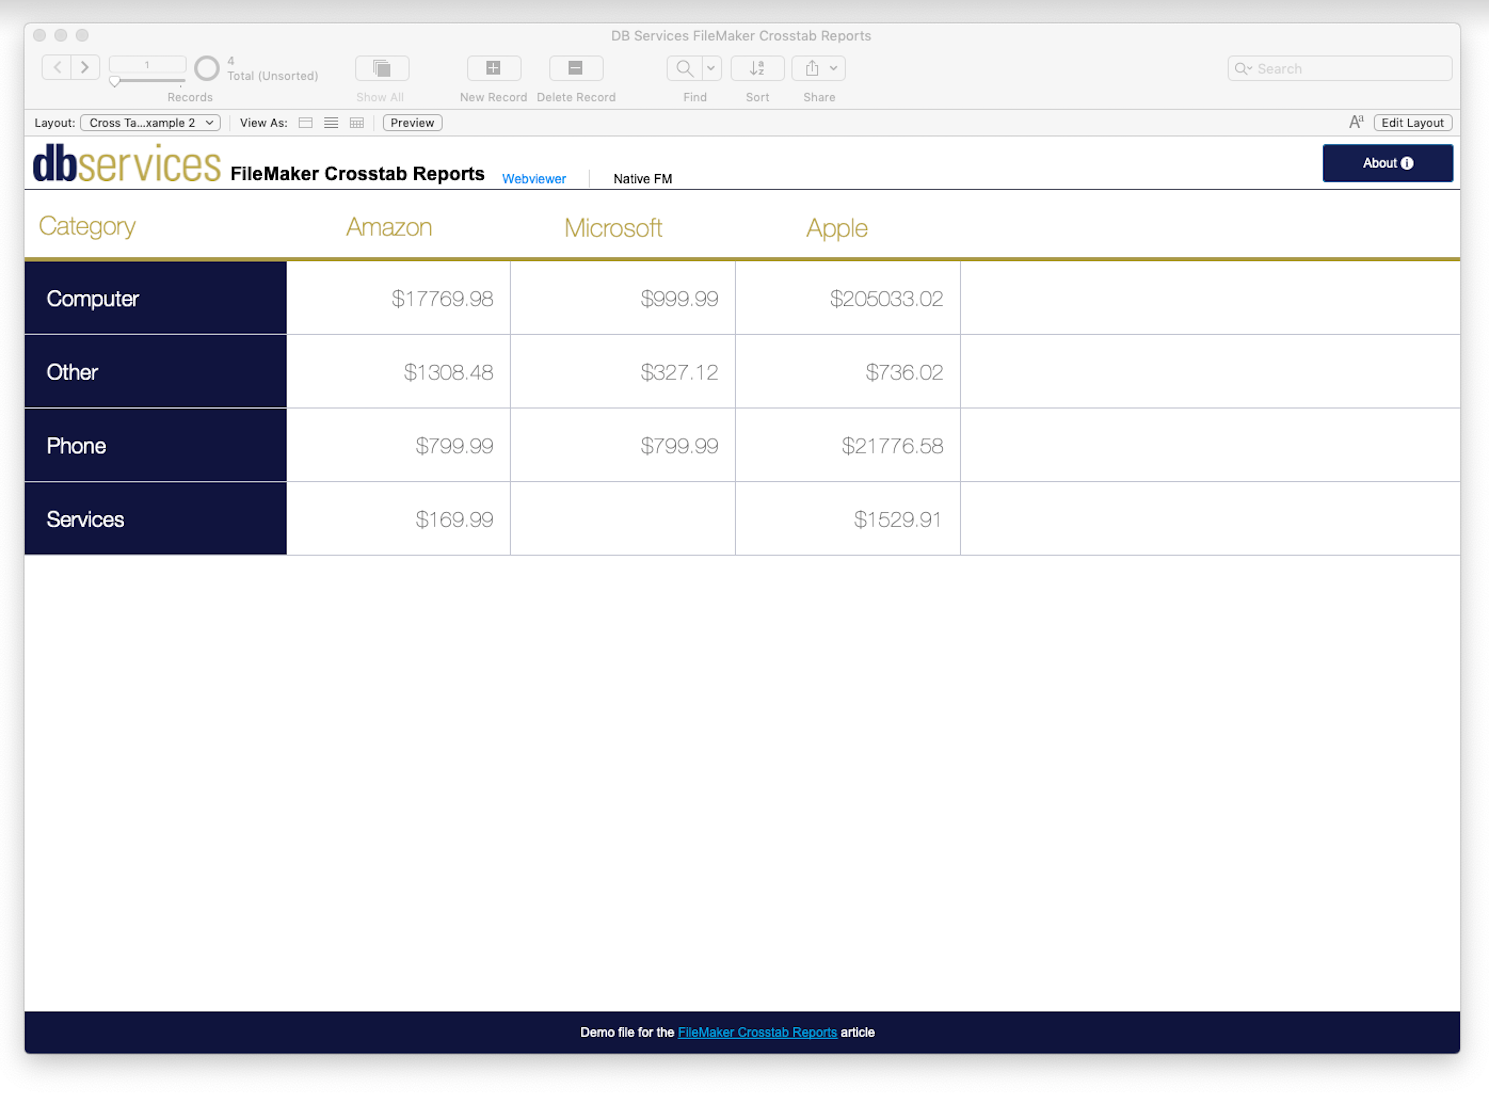
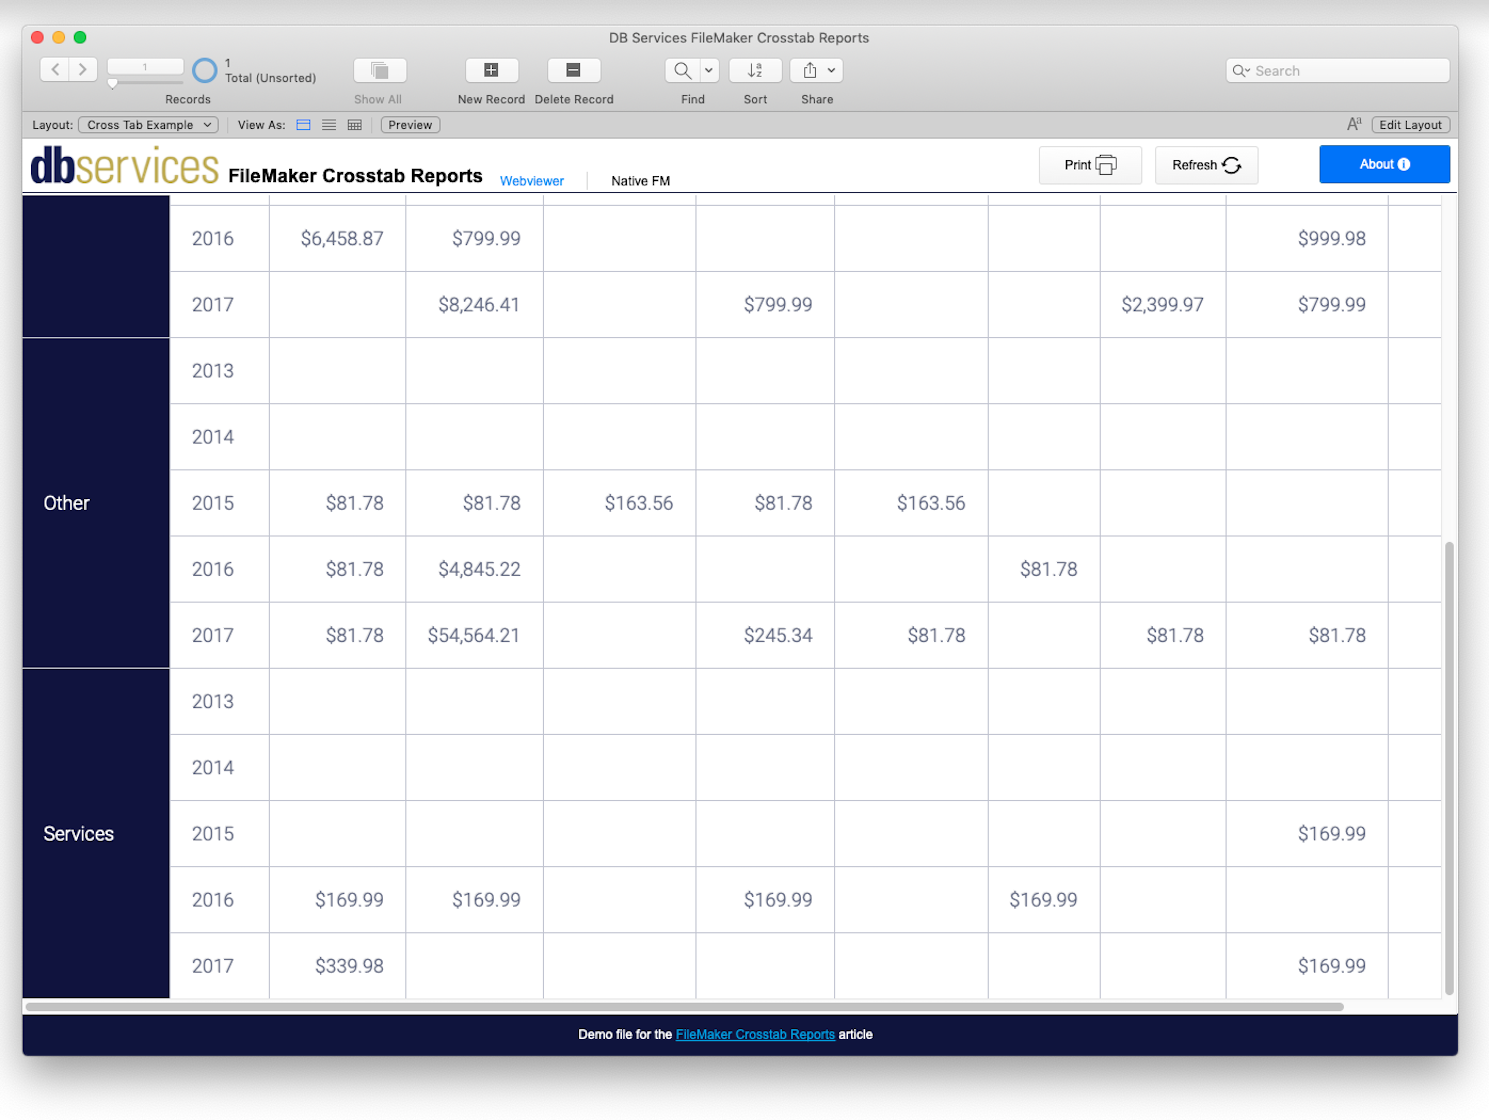
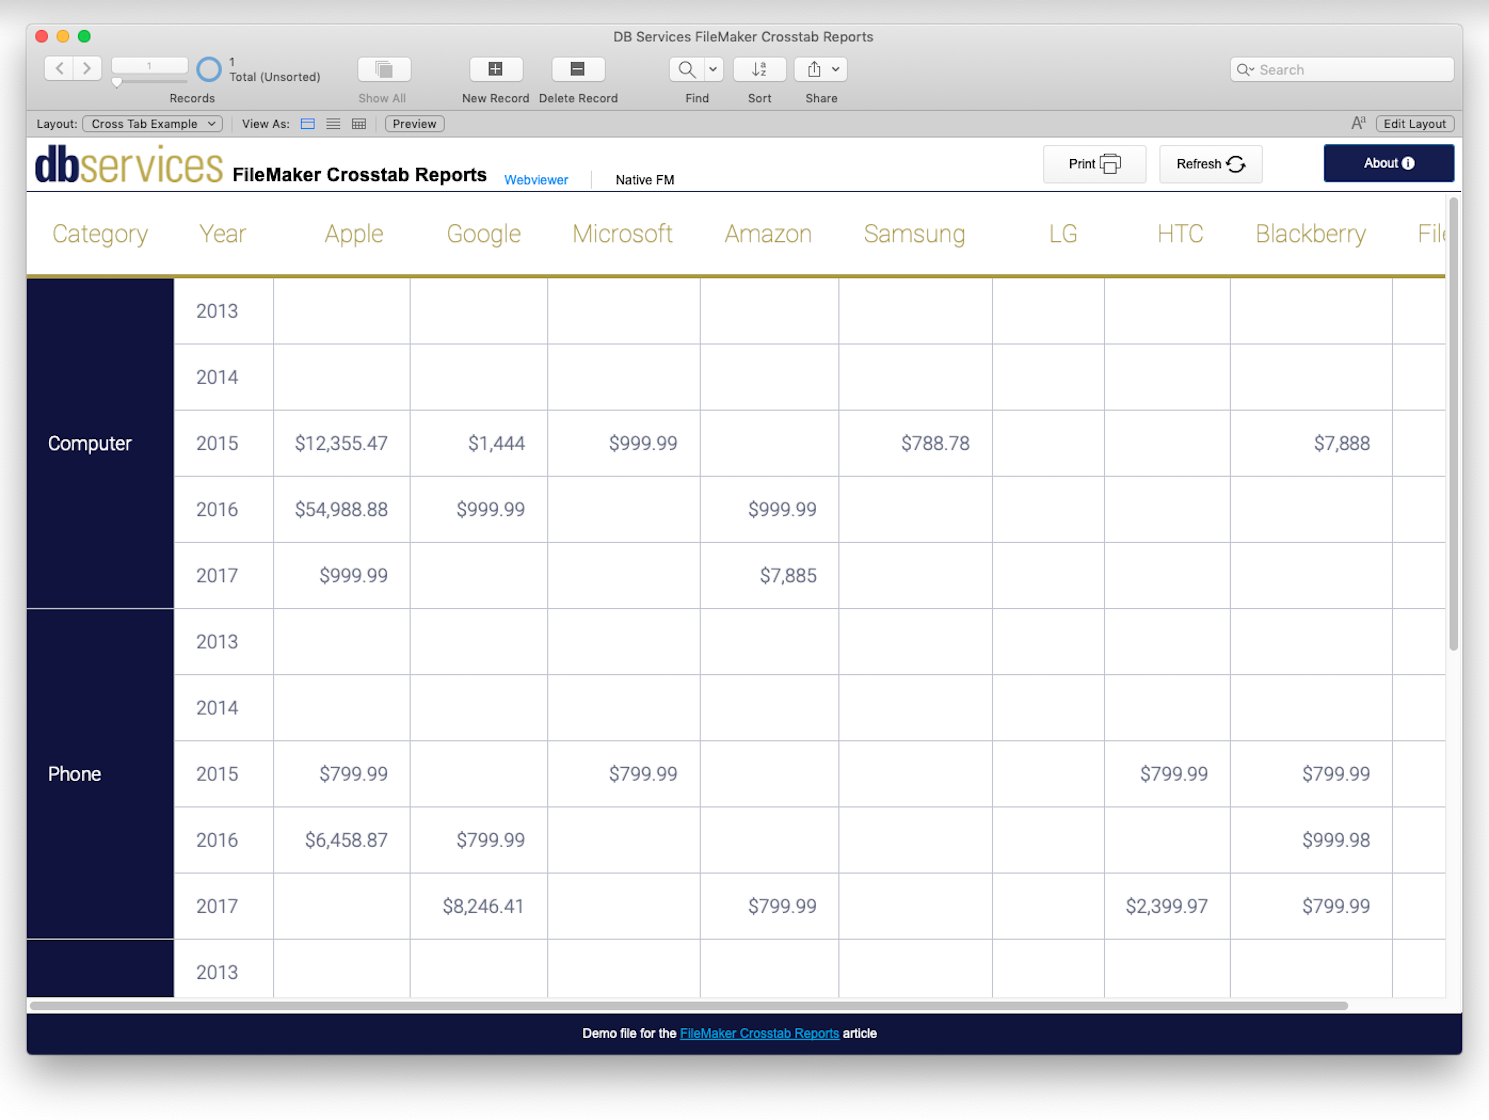
FileMaker is very adept at creating list reports, but often you want to see your data in a grid format. This is when crosstab reports, also referred to as pivot tables or matrix reports, come in handy. A crosstab report is a way to display data from 2 or more different sources in a grid format. Luckily there are still plenty of options for doing this in FileMaker. Some methods are better for data entry, some are better for viewing, and some are better for speed and flexibility.
Crosstab reports format groups of data into an easy to read grid format. If this sounds like an excel spreadsheet, that’s because it is. There is a reason people love their spreadsheets, it makes comparing values in one group with values in another group really easy. Below you can see an example of 2 reports showing the exact same data, but the crosstab report makes comparing company yearly sales much easier. This is why crosstab reports are so powerful.


